Source: Marga Santoso / Unsplash
Appendices for report 'Cracking the code: Using nature data to understand the impact of the ASX200'
Report
28 May 2026
Our online appendices, for the report 'Cracking the code: Using nature data to understand the impact of the ASX200', provide methodological detail, and sector and company-specific deep dives.
Click "Download" to view an Excel document containing the tables and figures in the below appendices.
Appendix 1. ASX 200 example sector and company analyses.
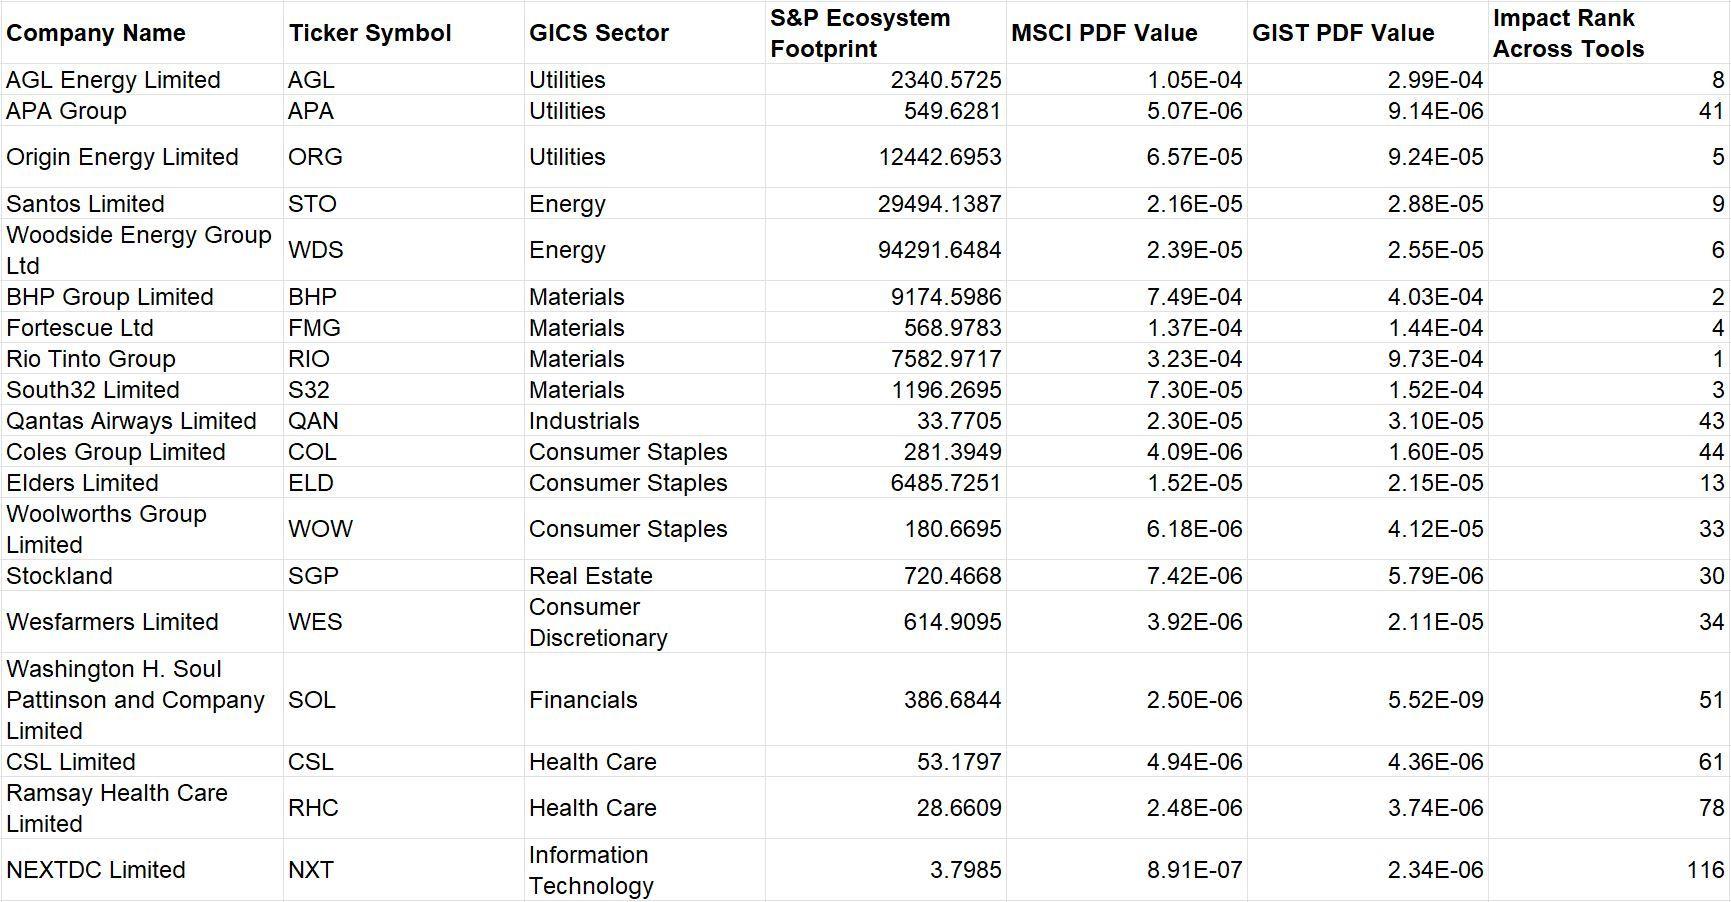
This appendix shows individual sector and company analyses for a selection of companies from the ASX200 with the aim of providing a more granular view of individual and collective findings about the impacts of a sample of ASX200 companies (Table 1) and a deeper dive into the drivers of those companies’ nature impact rankings across each sector. This section is provided as an indication of the sorts of things considered in both automated (tool) reviews of companies, as well as more deliberative evaluation of company impacts on nature, though a fully detailed and deliberative review of all ASX200 companies is beyond the scope of this report.
Table 1. This table presents a sample of company identifiers (company name, ticker symbol, and sector), impact information (the values of each impact metric from each tool), and the overall impact rank. The impact rank represents a company’s position within the ASX 200, calculated as the average of its rankings across the three tool-based metrics, with 1 indicating the highest (most impactful) rank.
Utilities
The Utilities sector in the ASX200 has the highest median nature-impact, driven by its only three members—AGL Energy (ASX: AGL), APA Group (ASX: APA), and Origin Energy (ASX: ORG)—all of which have nature impact footprints that place them in the top 50 impacting companies (Table 1). In particular, AGL and Origin stand out for their very high greenhouse gas (GHG) emissions and water usage, which are characteristically strong drivers of high ranking as viewed through biodiversity footprinting tools.
In FY2025, AGL Energy remained Australia's top carbon emitter, releasing 30 million tonnes of Scope 1 CO2-eq emissions, alongside 23 million tonnes of Scope 3 emissions. Origin Energy emitted approximately 16 million tonnes of Scope 1 CO2-eq and 28 million tonnes of Scope 3 CO2-eq in FY2024/25. This means just these two companies contribute to ~15% of Australia’s Scope 1 emissions.
The operations of AGL and Origin also consume large amounts of water to operate their power stations. For example, Origin withdraws 7,000 megalitres of salt water from Lake Macquarie for cooling generating units at its Eraring Power Station. This is the primary contributor to Origin's total withdrawal of 2.6 million megalitres, however most of this is returned with only 20 thousand megalitres of water consumed. While most of this is returned to the lake, this water extraction and return still has substantial impacts. Impacts occur through thermal pollution of returning warm water that has decimated Lake Macquarie's once abundant seagrass beds. In addition to water consumption, the Earring power station has experienced a substantial increase in five toxic pollutants, notably a 130% rise in mercury pollution which has adverse impacts on both people and nature.
AGL has two operational coal powered assets—Bayswater Power Station and Loy Yang A Power Station—that also consume substantial amounts of water and continue to release vast amounts of pollutants. AGL’s Bayswater and Loy Yang A power stations have both accumulated a long record of environmental violations. At Bayswater in New South Wales, one of the most serious incidents occurred in December 2019, when nearly 1,500 cubic metres of toxic coal ash slurry leaked into Bayswater Creek after a corroded pipeline burst. The leak went undetected for eight hours because monitoring systems were faulty and alarms had been switched off. Other spills have been frequent: ammoniated water, sulphuric acid, diesel, and coal ash have each entered local waterways, including Tinkers Creek and Wisemans Creek, contaminating habitats and even impacting endangered ecological communities. Coal ash management remains a major issue, with Bayswater producing around two million tonnes annually and expanding its ash dam to store an additional 12.5 million cubic metres. These repeated breaches have damaged surrounding ecosystems.
AGL and Origin have a history of significant pollution, particularly from their coal power plants. This makes them some of the most impactful companies operating in Australia, accounting for their high scores among Australian companies and the consequently poor nature impact score of the ASX200 Utilities sector.
Energy
The Energy sector is one of the worst environmental performers in the ASX200, with a median impact ranking second to Utilities (Table 1). The sector’s heavy oil and gas operations drive its high impact with its constituents producing enormous greenhouse emissions, strain water resources, and damage ecosystems directly. Woodside and Santos are the two most impactful firms in this sector. In 2024, Woodside’s operational (Scope 1 and 2) emissions were 6.8 million tonnes of CO2-e, and Santos’s were of a similar magnitude at 5.6 million tonnes of CO2-e in 2023. Downstream use of their oil and gas (Scope 3) contributes an order of magnitude more: were 73 million tonnes of CO2-e for Woodside in 2023 and 33 million tonnes of CO2-e for Santos in 2023. Both companies have announced targets (Woodside aims for net-zero by 2050; Santos by 2040 for Scope 1) but remain heavily reliant on fossil fuel revenues, leaving their current trajectories misaligned with the Paris Agreement’s climate goals according to investor critics, and still openly advertise the role of natural gas for “generations to come.”
Both firms also have substantial water footprints. Woodside’s operations used ~343 megaliters of fresh water in 2024. In contrast, Santos—with extensive onshore gas fields—reported a total water consumption of ~1,909 megaliters in 2024, of which 1,066 megalitres was freshwater.
Outside emissions and resource use, Woodside and Santos face scrutiny for their direct impacts on ecosystems through land disturbance and habitat degradation. Santos’s new Barossa gas project, for example, will industrialise a marine region of “global biodiversity significance” near the Tiwi Islands, with its pipeline crossing a protected marine park home to endangered marine species and critical habitats. Woodside’s expansion plans (e.g. extending the North West Shelf LNG facility and developing the Browse gas field) have raised similar concerns—the company’s own environmental assessments note potential harm to 39 threatened marine species (such as pygmy blue and humpback whales) and even to Indigenous heritage sites in the area.
In sum, neither company’s environmental footprint is yet aligned with international climate and biodiversity objectives. Woodside’s climate strategy has been criticized as “not aligned with Paris” due to reliance on offsets and plans for fossil expansion, and high-carbon projects like Barossa (projected ~380 million tonnes of CO2-e over its lifetime) are seen as directly undermining Australia’s emissions targets and global conservation efforts. This gap between stated ambitions and actual impacts is a growing concern for investors focused on long-term sustainability risks.
Materials
The Materials GICS sector comprises companies in chemicals, construction materials, containers & packaging, metals & mining, and paper & forest products. It ranks third-highest in median nature impact across the ASX200, yet this sector includes four of the most environmentally impactful firms in the index: Rio Tinto, BHP Group, South32, and Fortescue Metals (Table 1).
In particular, Rio Tinto and BHP illustrate the sheer scale of the Materials sector’s footprint. BHP’s value-chain (Scope 3) greenhouse emissions are about 378 million tonnes of CO2-e in 2024/25, while Rio Tinto’s were in the order of 574.6 million tonnes in 2024—tens of times greater than their own operational emissions. Rio Tinto’s total annual carbon footprint exceeds 605 million tonnes of CO2-e (~ 1.5% of global CO2-e emissions), comparable to the emissions from the electricity use of 127 million homes.
Industrials
The Industrials sector is broad encompassing companies from manufacturing and transportation to commercial services. The Industrials sector was ranked fourth overall in terms of impacts on nature, but had the highest range of rankings, highlighting the diversity of impacts that companies have within the sector.
Qantas Airways, is one of the most iconic brands within the Industrials sector, and who faces the immense challenge of decarbonizing an industry fundamentally reliant on fossil fuels. The airline's carbon footprint is substantial, with total reported carbon emissions of approximately 17.6 million tonnes of carbon dioxide equivalent (CO2e) in 2024, a figure equivalent to nearly 4% of Australia’s total annual CO2 emissions. The vast majority of these emissions are from direct operations (Scope 1), inherent to its business model of burning aviation fuel. While Qantas has publicly committed to a net-zero emissions target by 2050 and a medium-term goal to reduce its net Scope 1 and 2 emissions by 25% by 2030, a critical analysis by Climate Integrity found that its claims are not sufficiently backed by a credible, science-aligned methodology. The company’s business plan, which centers on growth and new ultra-long-haul routes, appears to contradict the "urgent and deep" emissions reductions needed for true decarbonization. Its heavy reliance on carbon offsets has drawn criticism, with allegations of “greenwashing” that pose a considerable reputational and regulatory risk for investors. A further sign of fragility in its commitments is the fact that Qantas has removed its single-use plastics and waste targets, citing a lack of suitable solutions and supply chain constraints.
Consumer Staples
The consumer staples sector can have significant impacts on nature, mostly through their upstream value chains. Much of the Consumer Staples sector relies on agricultural inputs. Agriculture is a major driver of environmental change: about 80% of global deforestation is driven by agricultural production, and farming accounts for roughly 70% of global freshwater use. Thus, companies in this sector carry a substantial nature footprint via their suppliers’ land and water use. In the ASX200, Elders has the greatest nature impact among consumer staples firms, with Woolworths Group and Coles Group following.
Elders is an agribusiness whose activities (from farm supplies to cattle feedlots) inherently use extensive land and water, resulting in high nature impacts. Beef production illustrates this: producing 1 kg of beef can require over 15,000 liters of water and large areas of pasture or feed-crop land. Livestock farming is also a leading driver of land-use change and deforestation globally and in Australia specifically. Elders’ own operations reflect these pressures—for example, cattle at its Killara feedlot account for ~62% of the company’s direct emissions, highlighting the outsized footprint of its agricultural products. The feed used for cattle in its feedlots would also contribute to the disproportionate level of water, chemical and land use relative to the calorific value of its output.
Woolworths and Coles have smaller impacts from their direct operations, but their upstream supply chains drive substantial nature impacts. Woolworths estimates about 96% of its total GHG emissions are from its supply chain, versus only ~4% from its own operations. While not formally reported, a similar trend would follow regarding water use, land transformation, and other pressures upon nature. Similarly, Coles finds its main impacts and dependencies on nature are concentrated in its farming and fishing suppliers. These upstream effects include intensive land and water use, high farming-related emissions, and pollution such as fertilizer runoff contaminating waterways.
Real Estate
The Real Estate GICS sector can have substantial impacts on nature, both through direct actions like land clearing and indirect supply-chain effects. Land-use change (e.g. converting natural land for development) is widely recognized as the single biggest driver of global biodiversity loss. While livestock is the primary driver of land clearing in Australia, and real estate developments have a much smaller footprint, these developments can be concentrated in areas of significant biodiversity. Real estate activities can affect all realms of nature – land (habitat loss, soil degradation), oceans (polluted runoff), fresh water (extraction and wetland disruption), and air (pollution and greenhouse gases). The built environment worldwide accounts for a huge share of resource use: roughly 40% of energy, one-third of carbon emissions, 20% of water consumption, and a large fraction of raw materials. These figures underscore the vast upstream impacts—from quarrying sand, cement and metals to generating electricity and water—that Real Estate companies can have.
Within the Real Estate sector, Stockland (ASX:SGP) was assessed across the tools to have the greatest impacts on nature. Stockland’s operations continue to generate substantial greenhouse gas emissions despite its decarbonization commitments. For FY25, total Scope 1 emissions were 2,155 tonnes of CO2-e, and total Scope 2 emissions were 32,121 tonnes of CO2-e. Their total water use was 818 megalitres, and their total land footprint was 121 km2. Their upstream impacts are likely much greater than reported, given the high number of development projects. These impacts are currently not disclosed.
Stockland's greenfield housing projects exemplify the real estate sector's high-risk land transformation impacts. Acknowledging that clearing undeveloped land for housing causes biodiversity loss, the company claims to be improving biodiversity management with ecologists and regulatory compliance. Despite these efforts, recent projects have faced significant backlash from local authorities and communities due to irreversible environmental concerns.
One high-profile example is the proposed Halls Creek expansion on the Sunshine Coast, covering roughly 1,200 hectares. The Sunshine Coast Council fiercely opposes this project, with Mayor Mark Jamieson warning that developing Halls Creek—part of the critical Glasshouse/Pumicestone inter-urban green break between Brisbane and the Sunshine Coast—would pose “a high risk of unacceptable environmental impacts on the Pumicestone Passage and [nearby] Ramsar wetlands”. Council insists the area serves as a vital ecological buffer and argues Stockland’s attempt to seek federal environmental approval under the Environmental Protection and Biodiversity Conservation (EPBC) Act is premature and lacks a lawful planning basis. Stockland, for its part, has responded by touting “world-leading” water management measures and a 3 km vegetation buffer (including rehabilitation of 400 hectares of habitat) in its Halls Creek proposal to mitigate harm to waterways and wildlife .
Similarly, in Ipswich (Queensland) the company’s Springview Village project has met intense community and expert opposition. The plan entails clearing about 167 hectares of the Woogaroo Forest—one of the region’s last intact forests—for a new housing estate. More than 15,000 people have signed a petition urging protection of this site. Prominent conservation biologist Professor Hugh Possingham cautions that the development will “fragment and destroy the threatened woodland bird community” in Woogaroo, which still harbors uncommon species like the Varied Sittella. Local ecologists note the forest is critical habitat for other declining wildlife as well, and fear the project could push some species closer to extinction.
Such controversies underscore the inherent risks posed by developers like Stockland within the Real Estate sector regarding nature. They emphasize the necessity of comprehensive planning to mitigate these impacts.
Consumer Discretionary
The Consumer Discretionary sector was assessed to have moderate impacts on nature relative to other sectors. In the Consumer Discretionary sector, the bulk of impacts on nature occurs in the upstream value chain of manufacturing and sourcing products, whereas the actual store-level operations (electricity, transport) are comparatively small. The type of impacts can vary substantially depending on the company. For example, the most impactful company in this sector was assessed to be Wesfarmers.
Wesfarmers is a large conglomerate whose businesses span both the Consumer Discretionary sector (e.g. Bunnings, Kmart, Officeworks) and areas more closely aligned with the Industrials sector (e.g. Wesfarmers Chemicals, Energy & Fertilisers). These subsidiaries differ markedly in how they impact nature, making the group’s overall impacts on nature complex to assess. Using GHG emissions as a proxy for broader nature pressures Wesfarmers may have highlights this variation. In FY2025, Bunnings reported Scope 1 and 2 emissions of ~25 kilotonnes of CO2-eq, Kmart ~161 kilotonnes of CO2-eq, and Officeworks ~11 kilotonnes of CO2-eq,. By contrast, Wesfarmers’ Chemicals, Energy & Fertilisers division emitted around 793 kilotonnes of CO2-eq—over four times the combined total of the retail arms. These industrial activities are also likely to involve far greater water consumption and pollutant releases than the store-based operations. However, the consumer-facing businesses could carry significant upstream impacts embedded in their products.
Bunnings, for example, sells large volumes of timber and timber-based products, potentially linking it indirectly to deforestation—one of the leading global and local drivers of biodiversity loss. Similarly, Officeworks’ reliance on paper products carries upstream land-use impacts. While many of these impacts may be reduced via sustainable sourcing policies , the embedded water use and land transformation undoubtedly still drives nature impacts, particularly as Bunnings‘ Responsible Timber Sourcing Policy continues to allow sourcing from natural forests, not only plantations.
These examples collectively highlight the difficulty of evaluating conglomerates due to the significant variation in nature impacts across subsidiaries and value chain segments. While direct operational emissions are prevalent in some businesses (e.g., fertilizer manufacturing), other businesses experience impacts primarily upstream in their supply chains (e.g., procurement of timber, paper, electronics). This demonstrates that sectoral classification alone is not always an effective method for screening impacts; a more detailed examination of individual companies is essential.
Communication Services
The Communications Services sector (telecoms and media) within the ASX200 exhibits a moderate level of nature impact relative to other sectors. The primary sources of these impacts are found upstream in the value chain, specifically through the procurement of goods and the consumption of energy and water. However, the downstream impacts, while less tangible and harder to quantify, can be considerable. Of this sector, the two most impactful companies were assessed to be News Corporation (ASX:NWS).
News Corporation was identified by the three assessment tools as the company with the most significant impact, primarily due to its direct contributions from elevated greenhouse gas (GHG) emissions compared to other firms in its industry sector. However, the company's role as a media conglomerate, particularly through its conservative outlets such as Fox News, Sky News, and The Australian, has arguably led to more significant downstream consequences by fostering doubt in climate science over many decades. A 2013 University of Technology Sydney study revealed that over 60% of climate-related articles published by two News Corp papers were either hostile or dismissive of climate science.
Financials
While the Financials sector's direct environmental impact from its own operations (offices, IT, paper) is minor compared to other ASX sectors—resulting in its third-lowest median assessed impacts—its financing activities can significantly contribute to nature degradation. This latter impact, however, was not measured by the tools used in this analysis.
Banks, insurers and asset managers channel capital into other industries—meaning much of their nature impact is indirect. For example, global analysis finds $7 trillion invested each year in activities that damage nature. Further, in Australia about AU$260 billion (22% of all bank loans) flows into sectors that present a high-risk to nature like agribusiness and mining. Such downstream financing (e.g. loans or insurance for oil, coal, mining, large-scale agriculture or deforestation) can drive habitat destruction, pollution and biodiversity decline. A key example of this is Soul Patts (ASX:SOL).
Soul Patts is a long-established diversified investment company, with large public holdings in high nature impact companies. Regarding its direct impacts, the company reports emissions from its head office are fully offset via GreenPower and Australian Carbon Credit Units (ACCU), with only about 3 tCO₂e offset—reflecting a minimal direct carbon footprint. Within their direct operations, we would expect low water usage comparative to other sectors and no direct pressures applied to ecosystems and nature directly. Its downstream impacts, however, appear to be substantial. Soul Patts holds a 43% stake in Brickworks Ltd. (ASX: BKW), a leading Australian building products manufacturer that produces bricks, masonry, roofing, and other construction materials. It also holds a 39% stake in New Hope Group (ASX: NHC), a diversified energy company whose core business is thermal coal mining and related infrastructure.
Soul Patts significant stake in New Hope Group demonstrate how the Financials sectors downstream value chain can cause severe environmental damage. First, the significant Scope 3 emissions from the New Hope Group’s thermal coal combustion are a major contributor to global warming. For instance, the 2022 New Acland Coal Mine expansion is projected to contribute approximately 170 million tonnes of CO2-eq over its operational lifespan. On land, New Hope’s mines have cleared important and sensitive areas: the New Acland project threatens to destroy prime agricultural land (among the top 1.5% of Queensland’s farmland) and has even decimated the local township of Acland, while the company’s Bengalla mine in NSW has razed bushland habitat for threatened species with required biodiversity offsets delayed for years . These projects may also jeopardize water resources—for example, the Stage 3 Acland expansion is licensed to extract up to 1 billion litres of groundwater each year, endangering farmers’ aquifers and potentially degrading water supplies for generations to come . New Hope has a record of environmental compliance breaches and controversies, including drilling of illegal water bores, conducting unapproved mining outside its permit areas (extracting ~10 million tonnes of coal beyond approved pits) . This pattern of high-impact damage and regulatory violations has sparked protracted legal battles and public outrage, underscoring the grave and far-reaching nature of New Hope’s environmental harms .
Soul Patts' Sustainable Investment Policy integrates ESG factors and active engagement with its investees for high-risk investments like New Hope. The policy's active ownership section asserts that investment values "include: serving shareholders; establishing governance practices which add to shareholder value; and the importance of maintaining a good corporate reputation through fair dealings, compliance with laws and ethical behaviour." However, with no explicit criteria addressing the preservation, restoration, or protection of nature, these values may conflict with broader sustainability goals. Firms within the Financial sector, while having relatively low direct impacts, can wield considerable influence. When their profit motives clash with conservation efforts, the consequences for nature can be devastating.
Health Care
The Health Care GICS sector ranked as the second least impactful sector in the ASX200 by median score. However, these rankings focused on direct impacts. Most of the nature impacts of healthcare arise upstream, through the emissions and resource use embedded in medical and research goods required for operations, and downstream, through the generation of both toxic and non-toxic waste. Within the ASX200, the two most impactful companies were assessed to be CSL (ASX:CSL) and Ramsay Health Care (ASX:RHC).
CSL is Australia’s largest biotech and pharmaceutical company, with its environmental impacts concentrated in water use, GHG emissions, and waste generation. In FY2024/25, the company reported producing 93.5 kilotonnes of waste, 286 kilotonnes of Scope 1 and 2 GHG emissions, and consuming 5.5 gigalitres of water. Interestingly, CSL does not disclose upstream impacts such as Scope 3 emissions—even though these are likely to exceed its reported Scope 1 and 2 footprint.
Ramsay Health Care is Australia’s largest private hospital operator, with more than 70 clinics and surgical centres. In FY2023/24, the company reported generating 44 kilotonnes of waste, producing 245 kilotonnes of Scope 1 and 2 GHG emissions, and consuming 3.6 gigalitres of water. However, Ramsay does not disclose its full Scope 3 emissions or other impact metrics associated with procured goods and services—an important gap given that much of the Health Care sector’s environmental footprint lies upstream and downstream in the value chain.
Information technology
The Information Technology GICS sector ranks as the least impactful in the ASX200 when measured by median direct impacts. However, as with Health Care, this low ranking can be misleading. While direct operational impacts appear small, the sector’s upstream and downstream impacts are significant. Significant pressures stem from the production of computers and electronic equipment. This is coupled with an increasing need for energy to power data centers and technological infrastructure, as well as a demand for water resources for cooling. This demand for water and energy is intensifying with the rapid expansion of large-scale data centres, which are central to powering the recent surge in AI . The resulting increases in energy consumption and water use pose a growing environmental concern with potentially devastating implications for nature.
Within this sector, the most impactful company was assessed to be NEXTDC (ASX:NXT). NEXTDC is Australia’s leading colocation data centre operator, enabling companies to share infrastructure rather than build private server rooms. NEXTDC's operations impact nature primarily through its energy and water consumption.In 2024/25, the company's greenhouse gas (GHG) emissions totaled 8 ktCO2-eq for Scope 1 and 338 ktCO2-eq for Scope 2. Additionally, NEXTDC's water withdrawal amounted to 773 MLitres. Given that water stress is a pressing concern, particularly as Australia is the driest inhabited continent on Earth, NEXTDC appropriately flag and acknowledge the importance of water as an environmental stressor which may worsen if not managed with increased roll out and demand of their services.
Appendix 2. Comparing companies’ absolute impacts on nature using the Land Conversion Equivalent (LCE) methodology.
Rio Tinto Group presents the highest total impact in the dataset at approximately 5,690 km² LCE, a figure largely driven by water consumption, which accounts for nearly 90% of its total footprint. However, the data reveals a significant anomaly: the company reports a land use impact of just 2.5 km². This figure is disproportionately low for a global mining company with vast open-cut operations and infrastructure, suggesting the model is capturing only a fraction of its physical footprint or failing to attribute the land occupation of its operations correctly.
BHP Group Limited follows with less than half the LCE of Rio Tinto at 2,354 km². BHP’s impact profile is driven primarily by water consumption, with waste generation and GHG emissions also significant contributors. Similar to its peer, BHP’s reported land use value of roughly 1.8 km² is physically implausible for a large mining entity.
South32 Limited records a total impact of roughly 890 km² LCE. Its profile is distinct among the miners, with damage drivers relatively evenly distributed across GHG emissions, water consumption, and waste. The reported land use of 0.4 km² is arguably one of the most significant underestimates in the dataset given the company’s diversified portfolio of aluminium, manganese, and coal operations, which typically require extensive surface area.
Fortescue Ltd reports a total impact of 843 km² LCE, driven overwhelmingly by water consumption (>90% of total impact). The reported land use impact of less than 2 km² is seemingly disconnected from reality, failing to account for the company's extensive iron ore pits and heavy haul rail infrastructure in the Pilbara region.
Origin Energy Limited has a total footprint of 540 km² LCE, driven by a combination of water consumption and GHG emissions. Like AGL, Origin reports a land use impact of 0.6 km². This overlooks the substantial physical footprint of its gas extraction wells, pipeline networks, and power generation assets, suggesting the tool is not effectively capturing the land occupation of the energy sector.
Mineral Resources Limited has a total impact of 493 km² LCE, driven almost entirely by water consumption. The data reports a land use value of 0.1 km², a physical impossibility for a company engaged in mining services, iron ore extraction, and lithium production. This highlights a critical data gap where the physical footprint of crushing, processing, and extraction sites is completely omitted.
Sandfire Resources Limited reports a total impact of 465 km² LCE. Uniquely, waste generation accounts for nearly 99% of this value, likely reflecting the high toxicity or volume of tailings associated with copper mining. The reported land use of 0.0 km² again suggests the model is missing the physical reality of the mine site and tailings storage facilities.
Alcoa Corporation total impact stands at 908 km² LCE. The drivers reflect the energy-intensive nature of aluminium smelting, with GHG emissions and acidification playing major roles. The land use value of 0.1 km² is remarkably low; while smelting is industrial, the upstream bauxite mining required to feed these refineries involves extensive land clearing, which appears to be unaccounted for.
Newmont Corporation has a total footprint of 794 km² LCE. Water consumption drives nearly 90% of its biodiversity impact. As the world's largest gold miner, the reported land use of less than 0.01 km² is a significant underestimate, failing to capture the large spatial footprint typical of gold extraction operations.
Santos Limited has a substantial global LCE of 168 km², consistent with the nature risks associated with large-scale oil and gas development. The impact is driven by the upstream and midstream infrastructure required for extraction. However, as with other energy majors, the land use component likely underestimates the fragmentation caused by pipeline networks and well pads.
Elders Limited shows a notable LCE of 126 km². As a key agribusiness enabler, this high figure is logical and likely driven by the upstream land and water use in the agricultural value chains it supports. Unlike the miners where land use was missing, high LCE here suggests the model may be better at capturing agricultural land conversion and water intensity than industrial mining footprints.
Qantas Airways Limited has a global LCE of 181 km², a high figure for a service-based company, reflecting the intense nature impacts of aviation fuel (GHG emissions) and supply chains. For an aviation company, the footprint is likely dominated by the upstream impacts of fuel and aircraft production and the atmospheric impacts of combustion.
Woodside Energy Group Ltd reports a 2023 global LCE of 149 km². While this is smaller than the diversified miners, it represents a significant footprint for a single oil and gas producer. The impact is driven by fossil fuel extraction and processing. The data likely under-represents impacts associated with offshore platforms and dredging, as well as the land use of the Burrup Hub processing facilities.
Wesfarmers Limited has a global LCE of 123 km², a significant mid-range footprint. This figure aggregates impacts across a diverse portfolio—from retail (Bunnings, Kmart) to chemicals and fertilisers. The impact is likely driven primarily by water use, with GHG emissions and waste production also contributing substantially.
CSL Limited LCE is 25 km². While not a heavy industrial emitter, this moderate footprint reflects the energy, water, and material intensity of large-scale biotechnology manufacturing and global plasma logistics. The impact is likely heavily weighted towards supply chain inputs rather than direct land clearing.
Stockland has an LCE of 34 km². This footprint is primarily driven by water use, likely reflecting the consumption at its assets. For a large diversified property development company, it is surprising that GIST Impact’s LCE value barely includes LCE from land use.
Ramsay Health Care Limited reports an LCE of 22 km². This moderate impact reflects the resource intensity of hospitals—high energy use, significant waste generation, and water consumption. It highlights that service sectors, while having lower direct footprints than extractives, still impose measurable burdens on biodiversity through their operational demands.
APA Group’s LCE is estimated at 53 km². While this is lower than the major emitters and miners, it represents a non-trivial conversion of nature. Given APA owns 15,000 km of pipelines, a low land use from GIST Impact figure suggests the model fails to account for the linear clearing required for pipeline easements, which can act as significant barriers to biodiversity movement.
NEXTDC Limited’s LCE is 14 km², relatively low in absolute terms but significant for the technology sector. The impact is likely driven almost entirely by the energy required to cool and power data centres, alongside the embedded impacts of the infrastructure itself. With the growing use of AI and deployment by large corporations, NEXTDC and similar data centre companies have potential to have rapidly increasing impacts through enhanced physical operations and indirect impacts through water and energy demand.
Washington H. Soul Pattinson reports a negligible LCE of 0.03 km². This is an example of how it is difficult to attribute impacts to holding companies. As an investment house, its direct operational footprint is tiny (office space), but its financed impact—through ownership stakes in companies like Brickworks, New Hope Coal, and TPG—is massive. This figure from GIST Impact only considers direct impacts and ignores the indirect financed nature impacts of its investment portfolio.
Appendix 3. An analysis of absolute impact and impact intensity (km2 per M USD Revenue).
When normalised by revenue, the distribution of impacts shifts materially, highlighting the importance of accounting for company scale and economic output across the full value chain. Coles Group Ltd. remains the most impact-intensive (0.632 total intensity), comprising direct intensity (0.003), upstream (0.256), and downstream (0.372) contributions, reflecting significant supply chain-driven biodiversity pressure relative to revenue.
Rio Tinto follows with a total intensity of (0.238), including direct (0.106), upstream (0.016), and downstream (0.116) components, consistent with the resource-intensive and extractive nature of mining operations, which exert substantial pressure on water systems, emissions, and land disturbance.
National Australia Bank Ltd. records a total intensity driven primarily by downstream effects, with upstream (0.010) and downstream (0.146) contributions, highlighting indirect exposure through financing and portfolio activities.
NextDC shows the lowest overall intensity, with direct (0.051), upstream (0.011), and downstream (0.032) contributions, reflecting its relatively efficient resource profile within a digital infrastructure context.
Across all companies, drivers, particularly water use and greenhouse gas emissions, are the dominant contributors to biodiversity impacts, reinforcing the systemic nature of value chain pressures.

Please note- The upstream and downstream intensity estimates are derived using EEIO modelling approaches and should be interpreted as directional indicators of relative pressure rather than precise, company-specific measurements, given structural limitations in EXIOBASE and similar datasets.
Appendix 4. Ecosystem Dependency Analysis
Based on the ENCORE (Exploring Natural Capital Opportunities, Risks and Exposure) methodology, GIST Impact measures dependencies through materiality ratings that assess the potential loss of function and consequent financial impact were ecosystem services to be disrupted. Dependencies can range from Very Low to Very High (also expressed on a 5-level ordinal scale) and cover 25 ecosystem services (ESS). Disruptions to these services, such as water scarcity, ecosystem degradation, or climate-related changes, can create significant business risks.
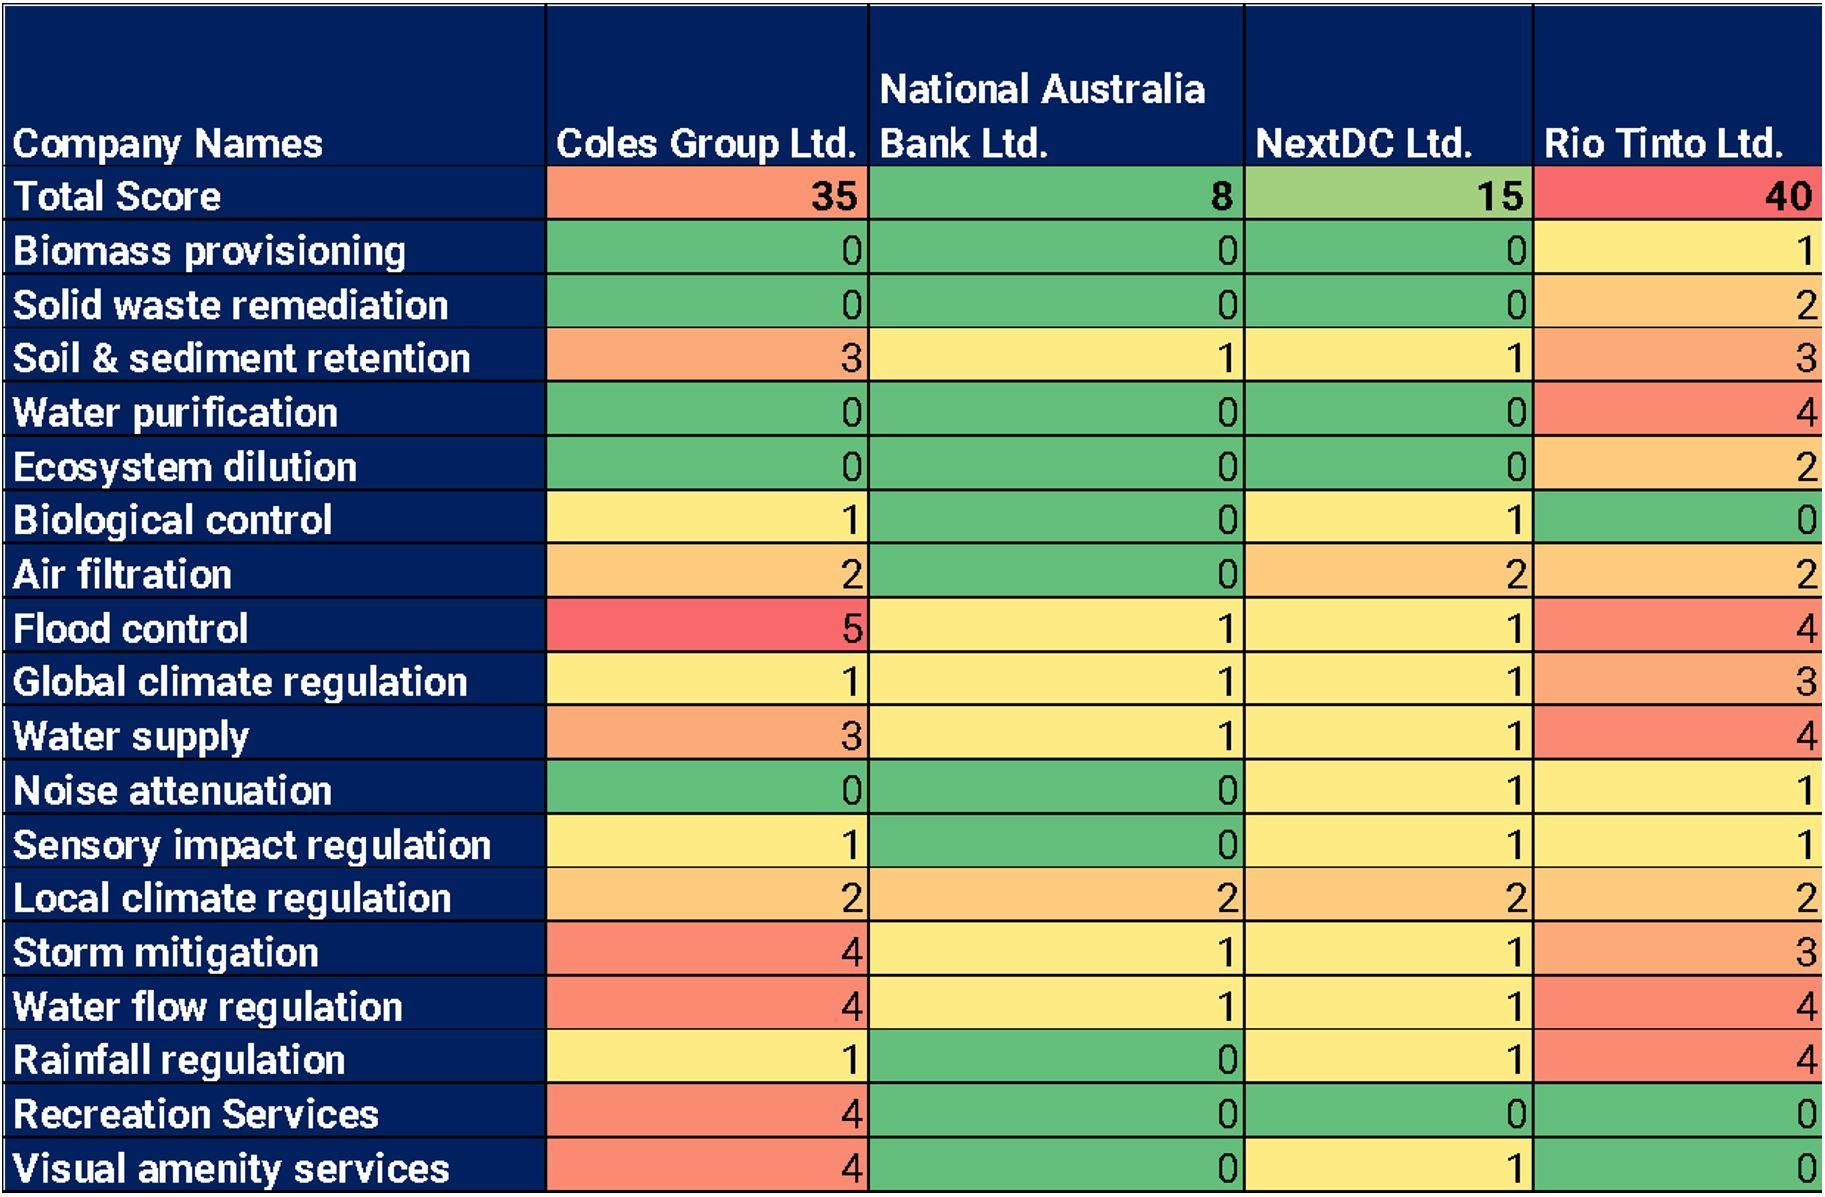
The dependency analysis provided by GIST impact using the ENCORE analysis reveals that companies with higher direct impacts also tend to exhibit stronger reliance on ecosystem services:
- Rio Tinto Ltd. records the highest dependency score (40), with critical reliance on water purification and rainfall pattern regulation, reflecting sensitivity to hydrological system stability.
- Coles Group Ltd. (score: 35) depends significantly on flood regulation, closely linked to agricultural productivity and supply chain resilience.
- NextDC Ltd. (score: 15) shows moderate dependence on local climate regulation, which influences cooling efficiency and operational stability.
- National Australia Bank Ltd. (score: 8) demonstrates comparatively low direct dependency, though systemic dependencies persist through its financing activities.
This pattern suggests a coupling between impact intensity and ecological dependency, particularly in resource-intensive sectors.
Mapping companies along an impact–dependency matrix provides an integrated view of nature-related risk exposure. The X axis is the LCE impact intensity (km2 per million USD Revenue), incorporating direct (chart a) and indirect impacts (chart b) and Y axis signifies the dependency scores. The vertical and horizontal lines express the mean values of the four companies. Constituents in the upper right-hand quadrant therefore deserve additional attention as underperformers, both in terms of a relatively elevated dependency score, and biodiversity impact intensity.
The indirect impacts should be interpreted as indicative of the general direction and relative magnitude of impacts rather than precise, company-specific measurements.
a) Direct Impacts vs Dependency Scores
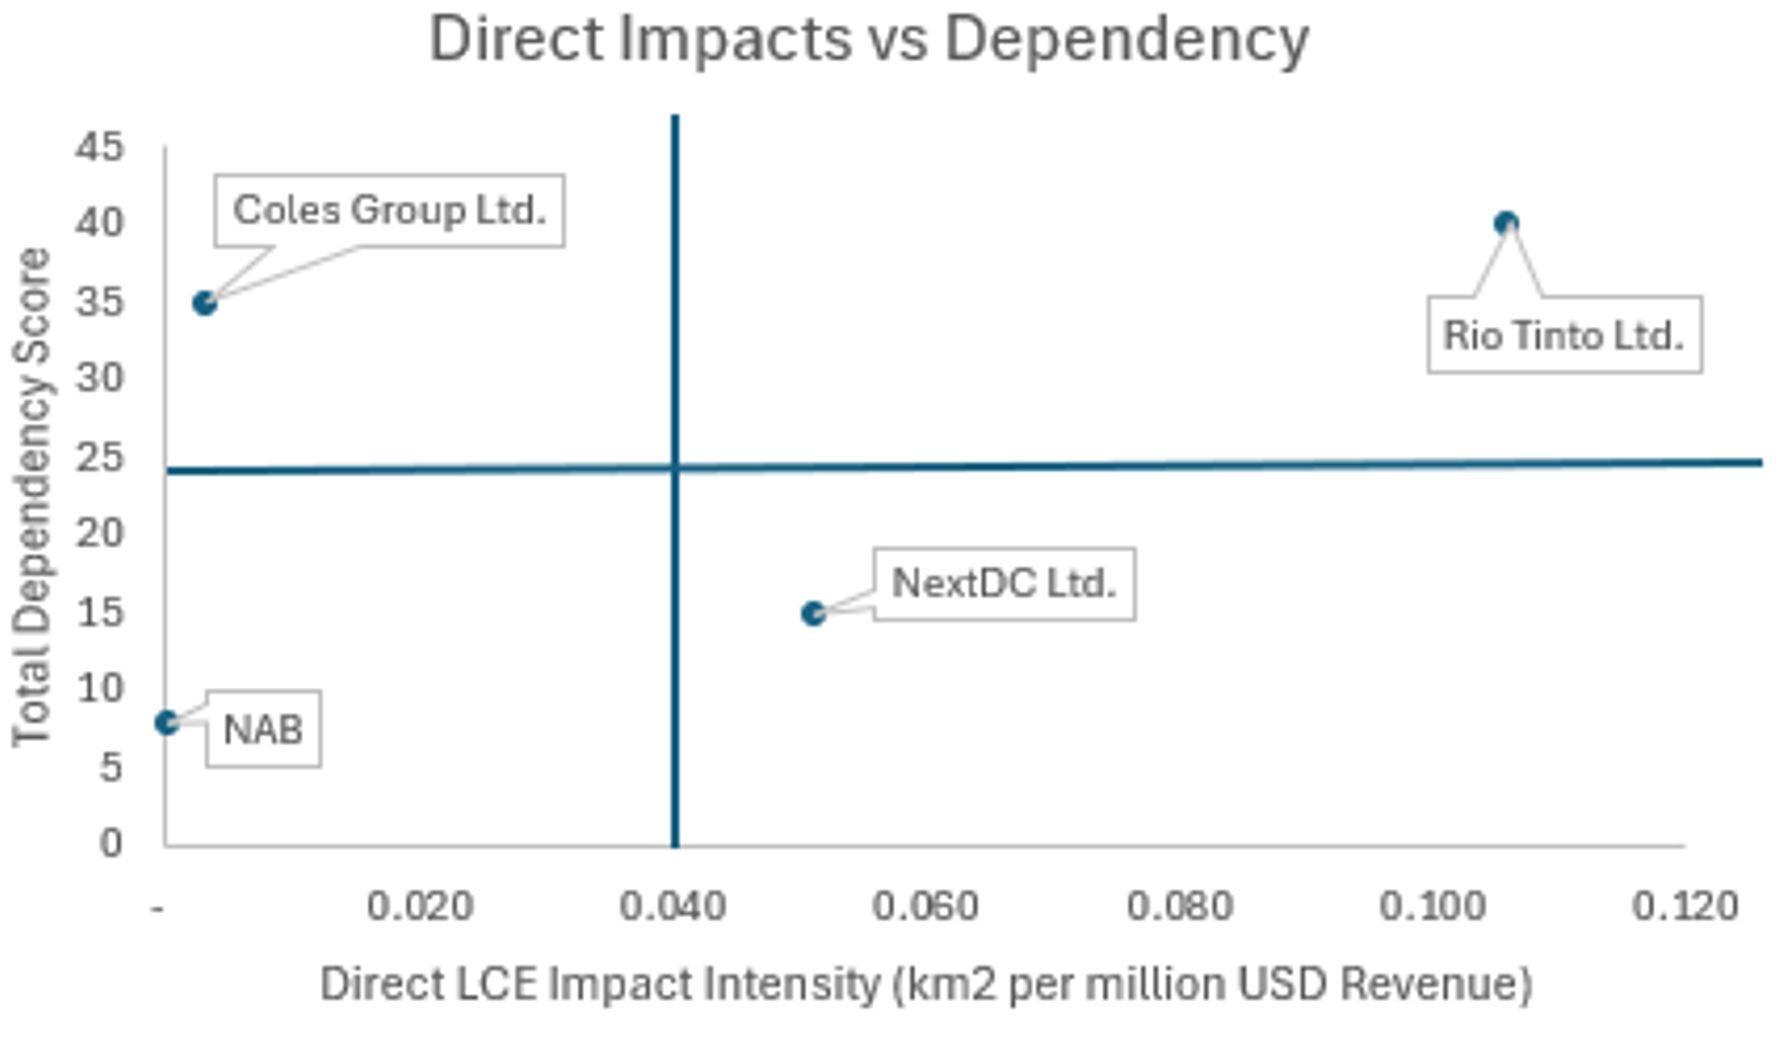
Rio Tinto Ltd. sits firmly in the high-impact, high-dependency quadrant (Q1). Its extractive operations drive significant water use, and biodiversity loss, while simultaneously depending on ecosystem stability (e.g., water availability, water purification). This dual exposure places it among the most vulnerable to tightening environmental regulation, physical disruptions, and reputational risk, necessitating comprehensive mitigation, restoration, and transition strategies.
NEXTDC Ltd. occupies a high-impact, moderate-dependency position. While its direct biodiversity footprint is relatively contained, its operations are resource-intensive, particularly in terms of water consumption for cooling and energy demand. This creates localized environmental pressures, especially in water-constrained regions, and exposes the company to operational and cost risks linked to resource scarcity.
Coles Group Ltd. falls into the low-impact, high-dependency quadrant (Q2). Its direct environmental footprint is comparatively limited; however, its value chain is deeply dependent on ecosystem services, including water availability and flood regulation. This highlights a critical exposure to upstream risks, particularly from climate variability and ecosystem degradation affecting suppliers.
National Australia Bank Ltd. lies in the low-impact, low-dependency quadrant, reflecting minimal direct interaction with natural systems. While direct impacts are limited by virtue of their operation of footprint, their supply chain impacts are likely present in terms of lending or funding to other high impact business activities such as agribusiness or mining etc. Please refer to the “Financials” sector analysis for more insight.
The positioning of National Australia Bank (NAB) and Coles Group (Coles) in the low-impact quadrant reflects a key limitation of the underlying methodology rather than their full real-world influence. The analysis captures only direct, operational impacts within company-controlled activities and does not account for indirect impacts arising from financing decisions (in NAB’s case) or supply chain procurement and sourcing (in Coles’ case). As a result, substantial downstream and upstream impacts are not represented. Similarly, dependencies on nature are assessed narrowly and may understate broader systemic reliance, particularly for financial institutions whose exposure is mediated through clients and portfolios.
b) Indirect Impacts vs Dependency Scores
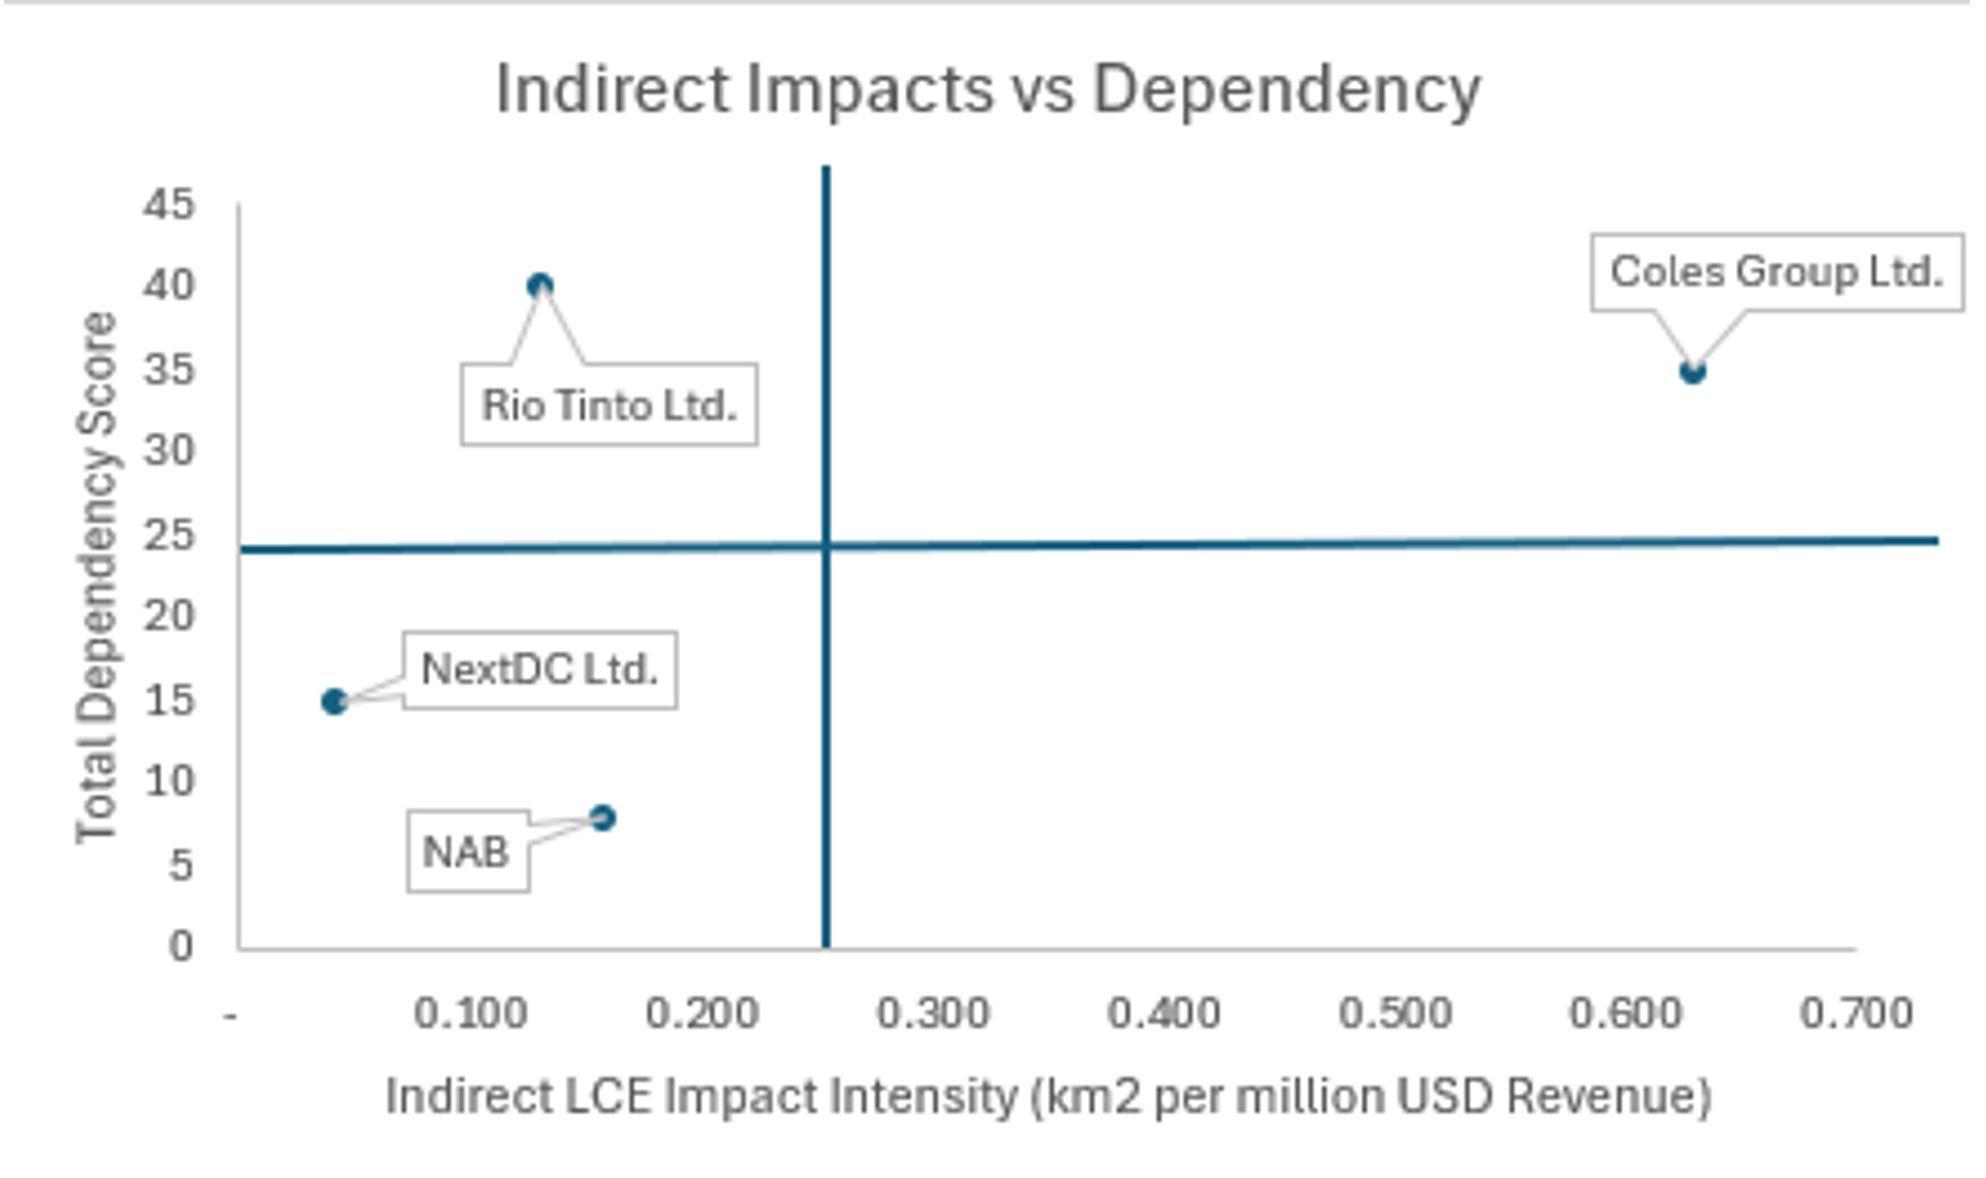
The chart highlights the relationship between indirect LCE impact intensity and total dependency score across selected companies. Coles Group Ltd. is positioned in Quadrant 1, indicating both high indirect impacts and high dependency relative to peers. This is largely driven by the nature of its operations, which rely heavily on the use and processing, of products and services across extensive supply chains. In addition, although Coles’ lower revenue base versus companies such as Rio Tinto results in a higher impact intensity metric (km² per million USD revenue). This suggests that Coles’ business model is more resource- and supply-chain-intensive relative to its revenue generation, increasing both its exposure to and dependence on ecosystem services.
Asset Exposure in Water-Stressed Regions:
Water stress emerges as a critical cross-sectoral risk driver, with material implications for operational continuity, cost structures, and long-term resilience.

Overall, the analysis demonstrates that sectoral context is the dominant determinant of nature-related impacts and dependencies, but it also reveals important nuances:
- High-impact sectors (e.g. mining) combine significant biodiversity pressures, strong ecosystem dependencies on water ecosystem services, and 62% exposure of Rio Tinto is attributed to high-risk activities in water- stressed regions, amplifying nature-related risks.
- Consumer-facing sectors (e.g., retail and wholesale) may exhibit low direct impacts but substantial indirect dependencies and impacts, underscoring the importance of supply chain transparency.
- Infrastructure and digital sectors can display moderate impacts, particularly where energy and water demands are concentrated.
- Financial institutions show minimal direct impacts, yet their system-wide influence through capital allocation necessitates expanded consideration of financed nature-related risks.
Appendix 5. A deep-dive analysis of the four mining companies’ biodiversity impacts
When considering absolute LCE impacts across the full value chain (direct, upstream, and downstream) BHP Group Ltd. has the highest total biodiversity impact, driven by direct impacts of (~2,354 km²), upstream (~555 km²), and substantial downstream impacts (~11,311 km²). This is followed by Rio Tinto Ltd., with the highest direct impact (~5,690 km²), alongside upstream (~833 km²) and downstream (~6,221 km²) contributions.
Fortescue Ltd. records a total LCE impact of ~5,630 km², consisting of direct (~843 km²), upstream (~225 km²), and downstream (~4,561 km²) impacts, while South32 Ltd. exhibits the lowest overall impact profile at ~1,209 km², comprising direct (~890 km²), upstream (~179 km²), and downstream (~140 km²) impacts.
These differences largely reflect variation in company scale, production volumes, and value chain structure, with downstream effects playing a particularly significant role for BHP and Fortescue, while South32’s impact is more concentrated in direct operational impacts.

Biodiversity Impact Intensity (km2 per M USD Revenue)
When LCE impacts are normalised by revenue and assessed across the full value chain (direct, upstream, and downstream), the ranking changes materially, highlighting differences in value chain structure and relative economic scale effects.
Fortescue Ltd. records the highest total impact intensity (0.3090), driven by direct intensity (0.0463), upstream (0.0123), and a dominant downstream intensity (0.2504). This indicates that Fortescue’s biodiversity footprint is heavily concentrated in downstream value chain processes, making indirect system-wide effects the primary driver of its overall intensity.
BHP Group Ltd. follows with a total intensity of (0.2555), comprising direct (0.0423), upstream (0.0100), and downstream (0.2032) contributions. Similar to Fortescue, downstream impacts dominate, indicating that indirect value chain effects are substantially more material than operational impacts.
Rio Tinto Ltd. records a total intensity of (0.2375), with direct intensity (0.1060), upstream (0.0155), and downstream (0.1159). Compared to peers, Rio Tinto shows a more balanced split between direct operational impacts and downstream effects, reflecting both significant extraction activity and broader value chain pressures.
South32 Ltd. shows the lowest total impact intensity (0.2207), driven primarily by direct intensity (0.1624), with smaller upstream (0.0327) and downstream (0.0256) contributions. This suggests that its biodiversity intensity is more operationally concentrated relative to peers, with comparatively less influence from downstream effects.
Fortescue and BHP are predominantly downstream-driven in terms of biodiversity intensity, while Rio Tinto and South32 exhibit relatively stronger direct-impact contributions, highlighting structurally different sources of nature-related risk within the same sector. One limitation of the downstream impacts are they are estimated numbers using EXIOBASE.

Ecosystem Dependency Analysis
The mining sector also shows strong dependencies on ecosystem services, with a sector benchmark dependency score of 40. Among the companies analysed, BHP and Fortescue records the highest dependency score (44), exceeding the sector average, followed by Rio Tinto (40) . Key dependencies include Water Purification and Rainfall Pattern Regulation, highlighting the sector’s reliance on stable hydrological and climate systems.
South32 also shows notable dependencies, particularly on Water supply, Water purification, Air Filtration, Flood control, Rainfall pattern regulation, Storm mitigation and Water flow regulation reinforcing the importance of water-related ecosystem services for mining operations.
Sectoral Insights
The mining sector demonstrates the dual nature of inside-out impacts and outside-in dependencies. Mining activities can significantly affect ecosystems through land transformation, emissions, and water use, while also relying heavily on ecosystem services to sustain operations.
High dependencies on water-related services expose companies to physical risks such as water stress, flooding, and water variability, which may disrupt production, increase operational costs, or affect asset viability. Understanding both impacts and dependencies is therefore critical for assessing nature-related risks and operational resilience.
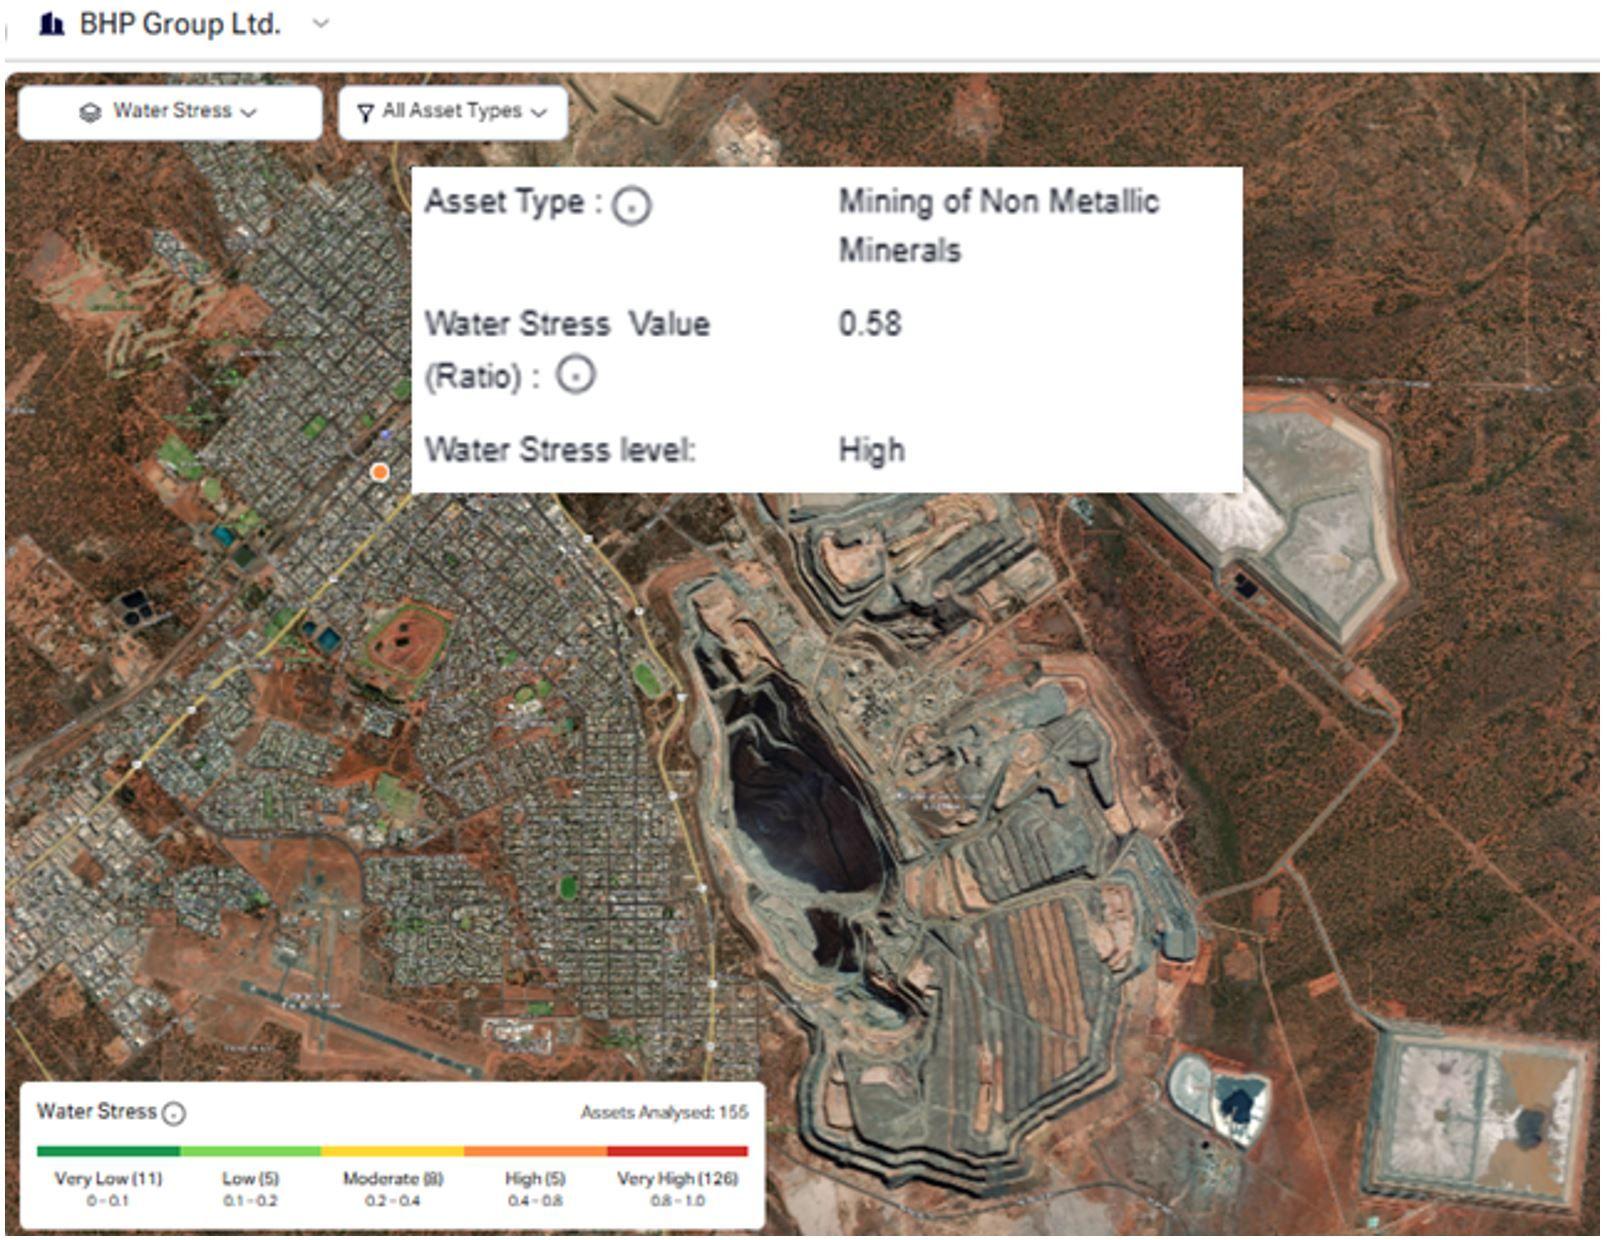
Company Example - For instance, BHP has approximately 155 assets, with 85% of these located in high or very high water-stress regions. With a dependency score of 44, above the sectoral average, the company demonstrates a strong reliance on water-related ecosystem services, which are essential for core mining processes such as mineral processing, dust suppression, and waste management. This high dependency increases operational exposure to water-related risks, including water scarcity, variability in water availability, and regulatory constraints on water extraction.